
Your AI agents might be costing you more than they’re helping. Without proper monitoring, they can give wrong answers, skip steps in workflows, or run up your API budget with endless loops. Here’s the bottom line: 89% of organizations now monitor their AI agents in production, and businesses that don’t are left struggling with hidden inefficiencies.
If your AI agent is slow (users abandon after 3–5 seconds of delay), makes errors (like hallucinating responses), or costs too much (runaway API calls), you’re losing money and customer trust. The solution? Set up a system to track performance, errors, and costs in real time. Tools like n8n, Make, and Zapier can help you:
- Track key metrics: Latency, error rates, and costs per task.
- Set up alerts: Catch problems like runaway loops or incorrect responses before they escalate.
- Tie costs to results: Connect your AI agent’s usage to CRM data to see if it’s worth the expense.
Monitoring turns AI agents from unpredictable black boxes into reliable tools. Keep reading to learn how to build a system that protects your budget and reputation.
Measure What Matters: Quality-Focused Monitoring for Production AI Agents
Key Metrics for AI Agent Performance
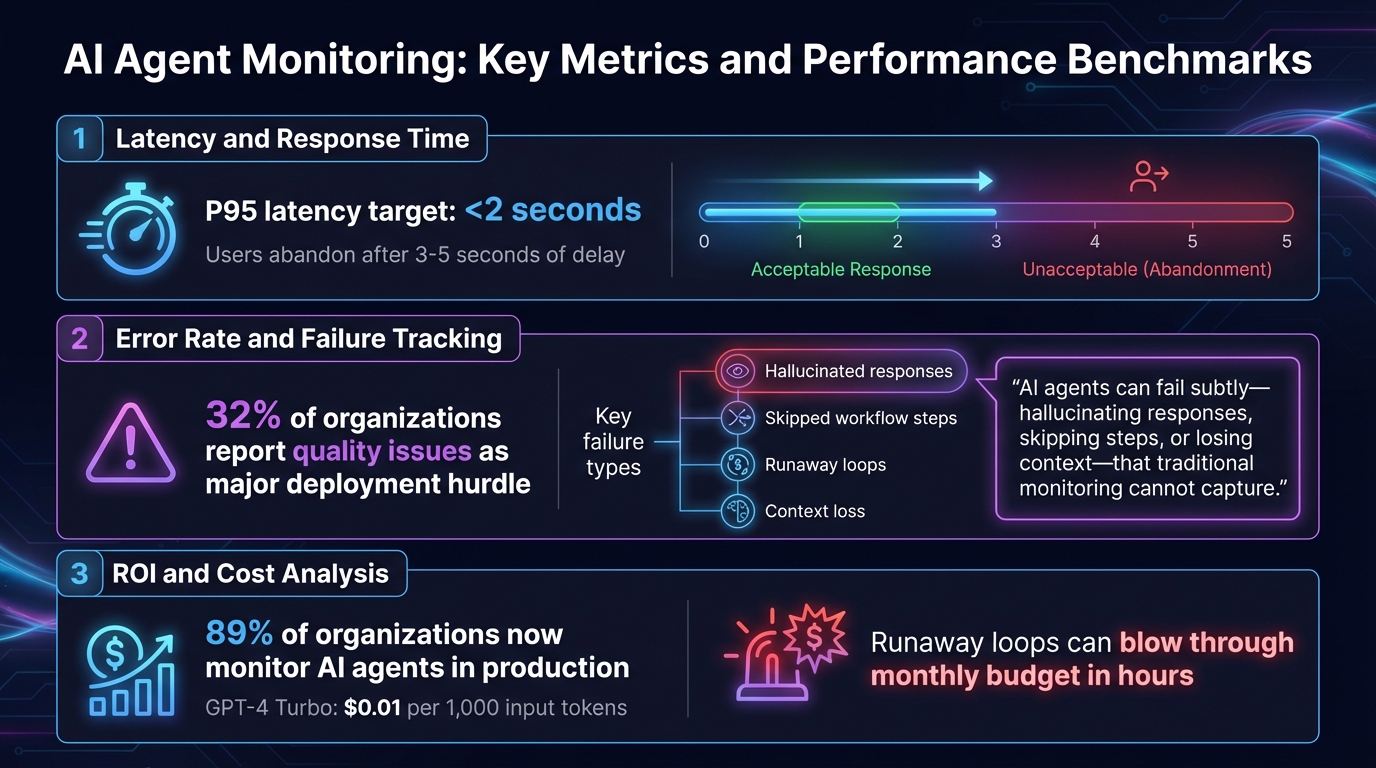
AI Agent Monitoring: Key Metrics and Performance Benchmarks
Understanding the right metrics can help separate AI agents that genuinely contribute to your business from those that waste resources with incorrect answers, missed steps, or excessive API usage. Having a clear view of the inner workings of your AI systems is essential. Below are the key metrics that can guide you in refining your AI agent’s performance – whether it’s an AI receptionist managing calls or a workflow automation tool handling repetitive tasks.
Latency and Response Time
Latency measures how quickly your AI agent responds – from the moment a user interacts to when they receive a complete answer. This includes every step: retrieving data, processing through the AI model, and executing any integrations.
Speed matters. Users tend to abandon chats if they experience delays longer than 3–5 seconds [1]. To avoid this, aim for a P95 latency of under 2 seconds, meaning 95% of responses should meet this benchmark. Latency slowdowns typically occur in three areas: data retrieval, model processing, or delays in downstream API calls (like those to Calendly or Salesforce). By monitoring each step in the process, you can identify bottlenecks – whether it’s switching to a faster model for simpler tasks or running API calls simultaneously to save time [3].
Error Rate and Failure Tracking
Error rate measures how often your AI agent fails to complete tasks correctly. Unlike traditional software, AI agents can fail in unexpected ways – offering made-up answers, skipping steps, or even getting stuck in loops that rack up unnecessary API charges [2].
"AI agents can fail subtly – hallucinating responses, skipping steps, or losing context – that traditional monitoring cannot capture." – Laura Clayton, Copywriter, UptimeRobot [2]
These issues can block your AI from being successfully deployed. It’s crucial to track both technical errors (like malformed API responses or broken integrations) and behavioral issues (such as confidently providing incorrect answers or ignoring user requests). For instance, if your AI sales chatbot struggles to qualify leads effectively, detailed error logs might reveal it’s pulling outdated data from your CRM – a problem that can be fixed by updating the integration rather than the AI model itself.
ROI and Cost Analysis
Cost tracking ensures your AI agent is delivering value without overspending. This involves monitoring token usage, API fees, and compute costs for platforms like n8n, Make, or Zapier [4].
For small businesses, "runaway loops" can be a costly problem – bugs that cause an agent to repeatedly call expensive APIs could blow through your monthly budget in hours [1]. Spikes in token usage or unexpected costs often signal workflow issues that need immediate attention. Cost analysis also presents opportunities for optimization. If your agent completes tasks correctly but takes an unnecessarily expensive reasoning path, you’re overpaying. By tracking costs per task, you can identify areas where smaller, faster models can handle simpler operations (like intent classification), saving the more resource-intensive models for complex reasoning [4].
This balanced approach is exactly how Open Head designs its custom AI consulting services – ensuring performance aligns with budget to deliver measurable results, not just empty promises.
Step 1: Set Up Logging and Tracing with n8n
n8n makes it easy to track every action your AI agent takes. The AI Agent node includes a "Logs" tab in the right-hand panel, where you can view all the inputs and outputs your agent handles[6]. This gives you a clear picture of the data your agent processes, how it responds to requests, and what it sends back – no need for extra tools.
For a real-time view, click the "Chat" button at the bottom of the n8n canvas. This opens a split screen: one side for interacting with your agent and the other for watching live logs of its actions[6]. You can even replay conversations to identify where the logic might be breaking down.
Keep multi-turn conversations on track by adding a "Simple Memory" sub-node. By default, this feature retains up to five exchanges, but you can adjust the limit as needed[6]. Without memory, your logs will only show isolated snippets of conversations, making it harder to follow the flow.
You can fine-tune your agent’s behavior by editing the system message under "Options." For advanced tracking, export logs using OpenTelemetry (OTel)[6]. If your agent starts giving inconsistent responses, reviewing the system message in the logs can help you spot vague or conflicting instructions.
Before going live, test everything with a "Chat Trigger" node and double-check your API key settings to avoid silent failures[6]. Misconfigured credentials for services like OpenAI or Gemini can stop your agent from working altogether. Open Head’s workflow automation services can simplify this process, ensuring your configurations and monitoring systems are ready for production from day one. This thorough logging setup sets the stage for building real-time dashboards and setting up proactive alerts in the next steps.
Step 2: Build Real-Time Dashboards Using Make
Make transforms AI agent logs into real-time dashboards that help you identify performance issues and control costs. Once you’ve set up logging, the next step is finding patterns without wading through endless data. Make’s HTTP module can pull information from nearly any AI agent framework – whether it’s LangChain, CrewAI, or OpenAI’s SDK – and consolidate it into one central dashboard[2]. This creates a foundation for deeper metric analysis in the following steps.
Start by visualizing key metrics like latency, cost, and error rates in a single view. Make’s time functions let you track how long tasks take from start to finish. For cost tracking, pull token usage data from your API responses and calculate expenses by multiplying the token count by the per‑1,000-token rate (e.g., GPT-4 Turbo costs $0.01 per 1,000 input tokens)[7][8]. This approach helps prevent runaway API costs from eating into your budget.
To go a step further, add a feedback loop that ties system performance to user satisfaction. For instance, integrate user ratings from your chat interface directly into the dashboard[8]. It’s worth noting that 89% of organizations now use observability tools for their AI agents, with 32% reporting quality issues as a major hurdle to deployment[1]. A dashboard that combines system health metrics with user feedback allows you to address problems before they escalate.
Traditional tools often struggle to detect AI-specific failures. Use your dashboard to track metrics like tool call success rates and intent accuracy, so you can quickly identify where things might be going wrong[2].
If building a custom dashboard feels overwhelming, Open Head offers workflow automation services that can create Make-powered monitoring systems tailored to your AI agents and business needs. With their solutions, you can turn raw data into actionable insights that improve efficiency. Once your dashboard is live, set up proactive alerts to catch issues as soon as they arise.
sbb-itb-2339147
Step 3: Configure Alerts and Error Handling in Zapier
Zapier takes raw monitoring data and turns it into real-time notifications that alert your team about potential issues before they escalate. Once your dashboard is set up, the next step is to ensure you’re catching problems as they happen – ideally before your customers even notice.
By connecting your monitoring system to Zapier using webhooks, you can send alerts directly to tools your team already uses, like Slack, Microsoft Teams, PagerDuty, or email. Use threshold-based triggers to avoid notification overload. For instance, set an alert if response time jumps from 1.2 to 4 seconds or if daily API costs exceed a specific limit[2]. This way, you can identify and address runaway loops or cost spikes before they strain your budget.
Traditional uptime monitors might miss "silent failures", where the system is technically online but producing incorrect results or getting stuck in loops[2]. To tackle this, set up keyword monitoring in Zapier to flag problematic phrases like "I didn’t understand that" or "I’m sorry, I can’t help", which often signal issues with intent resolution.
For added reliability, implement fallback logic. For example, if a 500 error occurs, Zapier can automatically switch to a backup provider and alert your engineering team[3]. In high-stakes situations, you can even route conversations to a human review queue for manual oversight[1][4]. When integrated into your dashboard, these workflows provide a safety net that keeps your systems running smoothly.
If you’d rather not handle the setup yourself, Open Head offers workflow automation services to create custom Zapier integrations that detect and resolve problems early, keeping disruptions away from your customers.
Finally, establish clear Service Level Agreements (SLAs) for key metrics like latency and accuracy, and let Zapier enforce them automatically[1][3]. This proactive approach ensures your operations stay on track with minimal interruptions.
Step 4: Track Costs and Usage with CRM Integrations
Once you’ve set up real-time monitoring and alerts, the next step is connecting your CRM to track costs and tie them directly to business results.
Your CRM is the key to understanding how AI agent costs break down by customer, lead, or support ticket. By integrating your agent’s telemetry with CRM records, you can pinpoint exactly where your budget is going and what’s driving those expenses.
Start by tagging every AI interaction with a unique CRM identifier. For example, pass metadata like user_id, lead_id, or account_id from tools like Salesforce or HubSpot along with each AI interaction [5][8]. This lets you allocate token usage and spending to specific customers or deals. If your cost-per-lead suddenly spikes, you’ll have the data to trace the issue back to a particular CRM segment and figure out if something like a retrieval error is driving up costs.
Pay special attention to how your AI agent retrieves customer data from your CRM. If it’s generating irrelevant responses, the problem might not be with the AI model itself – it could be due to outdated data in Salesforce or delays in HubSpot API calls [4][1]. By tracking retrieval latency and accuracy separately, you can catch these issues early and prevent them from turning into customer complaints.
Set up alerts within your CRM to flag high token usage and link spending to customer satisfaction. For instance, you might want to trigger an alert if token usage for a high-value account goes over $0.50 per interaction [2][1]. If those costly interactions are also getting negative feedback, it’s a clear sign your agent may need adjustments to work more effectively [8].
To streamline this process, tools like Open Head’s workflow automation services can help you connect your CRM to monitoring platforms with tools like n8n, Make, or Zapier. This setup not only tracks task-related costs but also ties AI expenses to metrics like cost-per-lead or cost-per-resolution. With this integration, you’ll ensure that every dollar spent on AI directly supports your business goals, staying true to Open Head’s focus on data-driven automation.
Best Practices for AI Agent Monitoring
Monitoring AI agents effectively is not something you set and forget – it’s an ongoing process that requires constant attention and regular evaluations to catch potential problems before they affect your customers. Companies achieving the best outcomes view monitoring as a continuous effort, not just a task to check off a list [1].
Start by building a framework that combines offline testing with live monitoring [3]. Before rolling out updates, test your agent in a controlled environment using fixed prompts and compare the results to established baselines. This "smoke test" method helps you identify issues early, preventing problematic code from reaching your users. Once the agent is live, monitor real-world interactions to uncover issues that only emerge during actual use. For instance, model drift – where an AI’s performance declines as input patterns change or models are updated – often becomes evident only in real-world scenarios [3][2]. With a solid testing framework in place, the next step is to set clear performance expectations through service-level agreements (SLAs).
Establish SLAs for key metrics like latency (e.g., 95th percentile under 2 seconds), accuracy (e.g., at least 0.92 fidelity), and cost per interaction [1][2]. Response times are particularly critical – users tend to abandon AI chats if responses take longer than 3–5 seconds. Monitoring latency at every step can help retain users [1]. Set up real-time alerts to detect issues like runaway loops and ensure flagged or high-impact interactions are routed to subject matter experts for manual review [1][2].
Cost management is another key component of effective monitoring. Use model routing strategies: assign smaller models to handle straightforward tasks like intent classification, while reserving more advanced large language models (LLMs) for complex reasoning [3]. Caching frequently used responses can also lower API call volumes and keep costs in check. If you’re managing multiple agents or intricate workflows, consider leveraging OpenTelemetry (OTel) for tracking and metrics. This ensures your data remains portable across different monitoring platforms, helping you avoid vendor lock-in [1][2].
For a seamless setup, you can collaborate with Open Head’s workflow automation services. They simplify the process by integrating tools like n8n, Make, and Zapier, making every action and handoff traceable from day one. This eliminates the hassle of piecing together open-source solutions and ensures your monitoring system is tailored to your specific needs – all without requiring technical expertise from your team. By following these practices, you can maintain a robust monitoring loop, ensuring your AI agents consistently deliver value to your business.
Conclusion
Monitoring isn’t just a nice-to-have for AI agents – it’s what turns them from potential liabilities into reliable revenue generators. The problem with many traditional tools is they only scratch the surface, focusing on uptime while missing deeper issues. Did your chatbot give an inappropriate response? Did your scheduling tool send a team to the wrong time zone? These are the kinds of failures that can slip through unnoticed without proper oversight[2]. With 89% of organizations now adopting observability for their AI systems, skipping this step could leave your business playing catch-up[1].
For small business owners, building a monitoring system from the ground up can feel overwhelming. It’s not just about checking if something works – it’s about having a full view of every interaction. This means tracking every prompt, tool call, and output, along with real-time alerts for critical issues like hallucinations or unexpected API costs[2][3]. Trying to piece this together on your own can quickly become expensive and time-consuming.
That’s where Open Head’s workflow automation services step in. They handle the heavy lifting, using tools like n8n, Make, and Zapier to create monitoring systems designed with observability built right in. From day one, every action is traceable, with custom dashboards, automated alerts, and seamless CRM integrations tailored to your needs. You get a system that’s ready to go, without spending months trying to figure out how to build it yourself.
If you’re ready to take control of metrics like response quality, cost efficiency, and overall performance, schedule a free consultation with Open Head. They’ll review your current setup, pinpoint any weak spots, and deliver a monitoring system that keeps your AI agents on track while protecting both your reputation and your budget. Starting with a solid monitoring foundation ensures your AI tools work smarter – and your business runs smoother.
FAQs
What metrics should I track to measure the performance of AI agents?
To gauge how well your AI agent is performing, keep an eye on these key metrics:
- Goal completion rate: How often does the agent successfully achieve its intended task? This tells you if it’s meeting expectations.
- Error rate: How frequently does it make mistakes or fail? Lower is always better here.
- Response time: How quickly does the agent provide answers? Speed matters, especially in user-facing scenarios.
Beyond these basics, dig deeper with:
- Resource usage: Monitor CPU and GPU consumption to ensure the agent isn’t overloading your systems.
- Tool-call frequency: Track how often the agent relies on external tools. This can reveal inefficiencies or over-reliance.
- Feedback scores: Collect evaluations from users or human reviewers to understand how well the agent is performing from a qualitative perspective.
By keeping tabs on these metrics, you’ll have a clear picture of whether your AI agents are running smoothly, staying accurate, and delivering real value to your business.
How can I monitor my AI agents to quickly catch and address issues?
To keep tabs on your AI agents, start by pinpointing the key endpoints they depend on – things like API URLs, webhooks, or scheduled tasks. Tools like UptimeRobot can help you monitor these endpoints, keeping an eye on uptime, response times, and latency. Set clear thresholds for alerts, such as downtime lasting more than 2 minutes or response times slower than 3 seconds.
For alerts, connect your monitoring tool to platforms like email, Slack, or Microsoft 365. If you want to take it a step further, automation tools like Zapier, Make, or n8n can kick off actions like logging tickets in HubSpot, restarting services, or notifying your team instantly. Don’t forget to regularly review incident logs to fine-tune your monitoring system.
If you’d rather not handle this yourself, Open Head can create a custom monitoring and alert system tailored to your business. Schedule a free consultation, and they’ll take care of the setup for you.
How can I track AI agent costs and link them to business results using my CRM?
To tie AI agent costs directly to your business results, start by syncing the agent’s activity data with your CRM. Tools like n8n, Make, or Zapier, powered by Open Head’s custom automations, can log every interaction – tracking prompts, tool usage, and response times. This setup lets you link costs, such as cloud compute time or API calls, to specific workflows and connect them to CRM records like leads, deals, and revenue.
With this data in hand, you can measure key metrics like cost per lead, cost per meeting, or ROI per sale. Open Head simplifies this further by building custom dashboards within your CRM. These dashboards map every AI-driven interaction to outcomes like closed deals or revenue growth. The result? A clear picture of how your AI agents impact your bottom line – without the headache of handling the technical setup yourself.